In June 2013 Frack Free Chew Valley convened a meeting in Chew Magna and invited 20 local parish councils to attend. The next week the Conservative councillors in Bath and North East Somerset (BANES) tabled a motion to oppose unconventional gas development and this was supported by both the Lib Dems and Labour. Eventually all of the licences in BANES were relinquished and the gas has remained in the ground (where it belongs) not in the atmosphere.
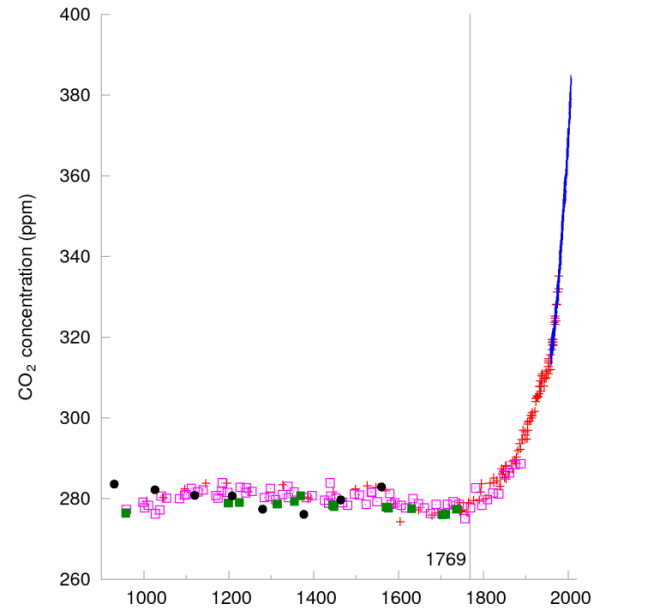
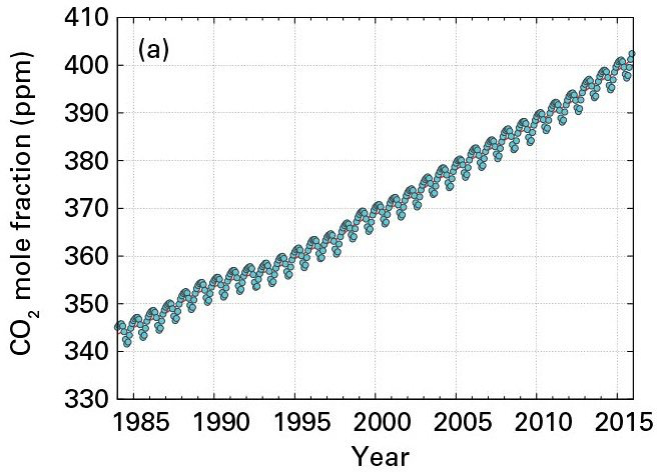
During that meeting a slide was shown of atmospheric CO2 concentrations with time. This graph, produced by the late Professor David MacKay, showed atmospheric CO2 concentrations hovering around 395 parts per million (ppm). In June 2013 it had just been reported in the media that the symbolic 400 ppm had just been touched, although the values varies with the season. A safe concentration is considered to be 350 ppm to avoid the possibility of “seeding irreversible catastrophic effects”.

CO2 Concentration with time. 1769 was the year that James Watt patented his steam engine. The blue line are direct CO2 measurements at Mauna Loa in Hawaii.
The World Meteorological Organisation has just reported that the 2015 global average was 400 ppm, pushed past the post by the recent El Niño warming event. These cumulative concentrations are going in one direction (so far as people who are alive today are concerned) and will persist for generations.
Meanwhile, climate change denial remains alive and well in the West of England with UKIP MEPs proud to deny the science, MPs peddling misinformation on renewables, and journalists engaged in extreme cherry-picking (the rebuttal).
Far better to go to someone who knows what he is talking about (and who has got a Nobel Prize):
Here are the resources he is talking about. Have a read!

