Frack Free Somerset report on test drilling in West Sussex – Read about it here
Author: frackfreecv
Chew Valley Neighbourhood Plan
You have an opportunity to contribute your views on what happens in your local area in terms of location, size, pace and design of developments. There are open events during July and August – see http://www.cvnp.co.uk. These events give people who live and work in the area the chance to comment on what they would like to see included in the Chew Valley Neighbourhood Plan.
Why Wytch Farm is a poor fracking comparison for Somerset – Part II
BP Shuts UK Field After Oil Leak
This post updates Why Wytch Farm is a poor fracking comparison for Somerset with the new information we have from the Department of Energy and Climate Change (DECC) on the reality of coalbed methane (CBM) production in Chew Valley and the surrounding areas of Somerset and why the two don’t bear comparison. The information presented below is all based on data from DECC, the British Geological Survey and the Ordnance Survey.
What is Wytch Farm?
Wytch Farm is an oil and gas field on the south coast of England, it is described as “the largest onshore oil field in western Europe” despite the fact that most of it is offshore.
What is the significance of Wytch Farm?
In relation to unconventional gas in Somerset Wytch Farm is significant because some people say the development at Wytch Farm shows that similar development in Somerset needn’t be obtrusive – read on.
Where is Wytch Farm?
The onshore processing facilities and oil and gas wells are located on the shoreline of Poole Harbour between Corfe Castle and Bournemouth. The oil field (shown in pink in the figure below) occupies 47.6 sq km in total, of which 16.9 sq km (35%) are onshore and the rest offshore (64%).
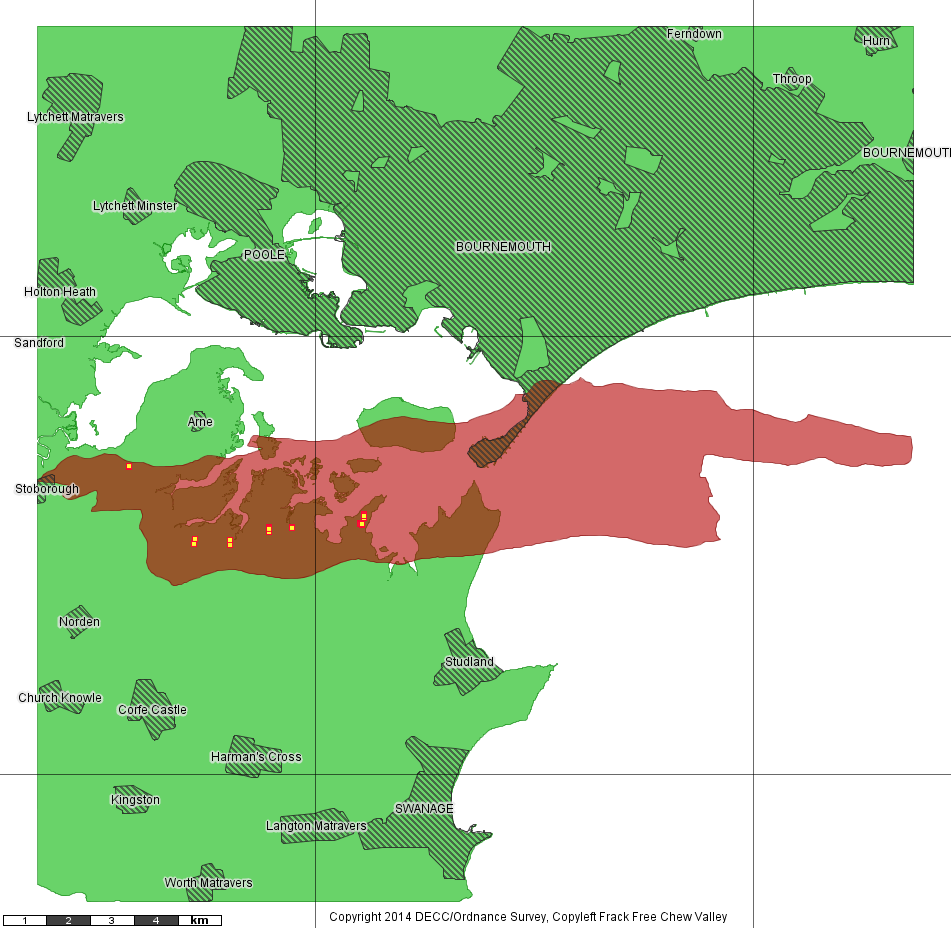
Wytch Farm Oil Field shown in pink. Wells in yellow. Onshore or offshore?
How many Wells are at Wytch Farm?
There are 200 wells at Wytch Farm all of which are classified by DECC as conventional oil and gas wells, NOT shale gas or coalbed methane. Of these 55 of the wells (28%) are either in the English Channel, in Poole Harbour or on Furzey Island, which leaves 145 onshore wells (72%). Some of these wells have used directional drilling to extend up to 11 km under the English Channel.
How deep are the wells at Wytch Farm?
The wells at Wytch Farm are approximately 1,600m (5,250 feet) beneath the surface. By comparison the DECC/GeoMet report on potential CBM wells in Somerset is based on wells from 152 m (500 feet) to 1,524 m (5,000 feet) depth, so potentially ten times shallower than at Wytch Farm.
What do the Wytch Farm facilities look like?
Have a look at the links in the first posting Why Wytch Farm is a poor fracking comparison for Somerset, here is an example from Southampton University:

It is not visible to the public because almost nobody lives within miles of it, read on.
What impacts have the Wytch Farm developments had on local communities and how similar might this be to the Somerset case?
There is no direct answer to this post development but it is reasonable to assume that proximity of communities to the wells in an important factor in terms of traffic, air, noise and light pollution. It is worth also noting that any surface spillage at Wytch Farm would drain into Poole Harbour whereas surface spillage in Somerset may drain into Bristol’s potable water supply.
As an indicator of local impacts how many buildings occur within a 2 km radius of the wells and Wytch Farm compared with the potential CBM wells in Somerset – according to the DECC/GeoMet assessment? Note that Dallas City Council has banned fracking within 1,500 feet (460m) of any residence, school, place of worship or protected area.
Using Ordnance Survey OpenData of buildings there is a total of 6 hectares of buildings within 2 km of the onshore wells at Wytch Farm. This includes residential, farm and industrial buildings including the oil processing facilities themselves.
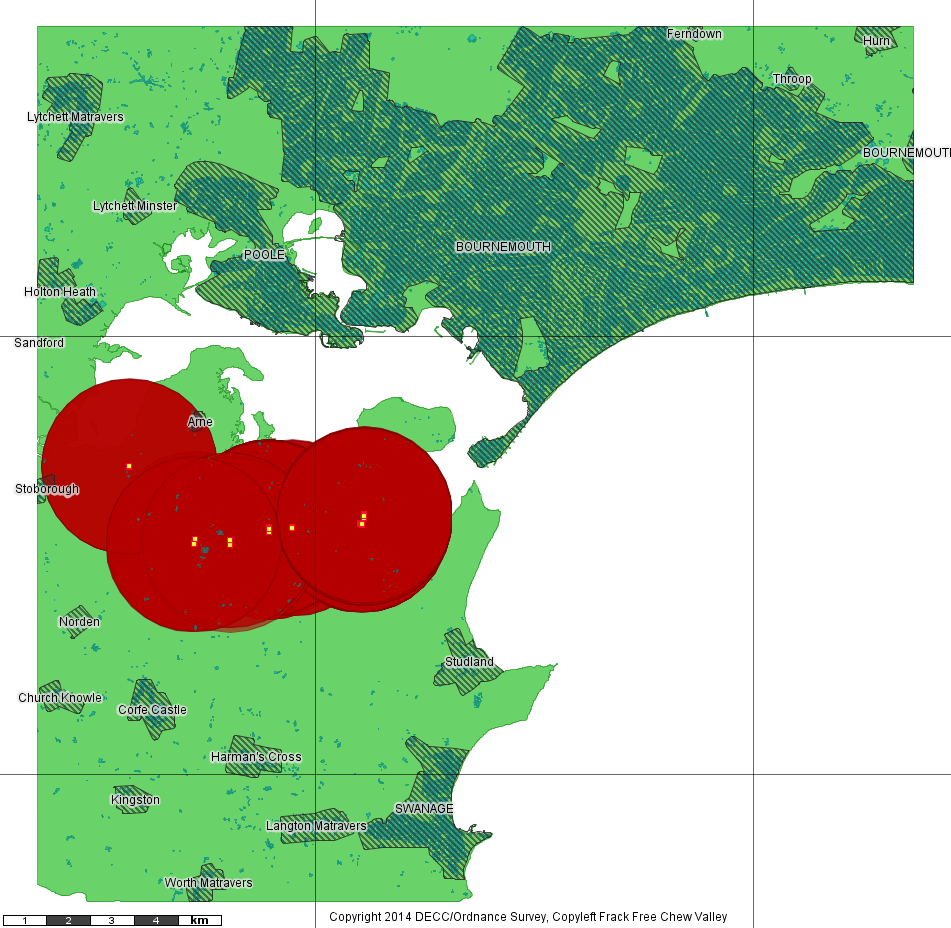
Wytch Farm Onshore Wells, 2km buffer in red
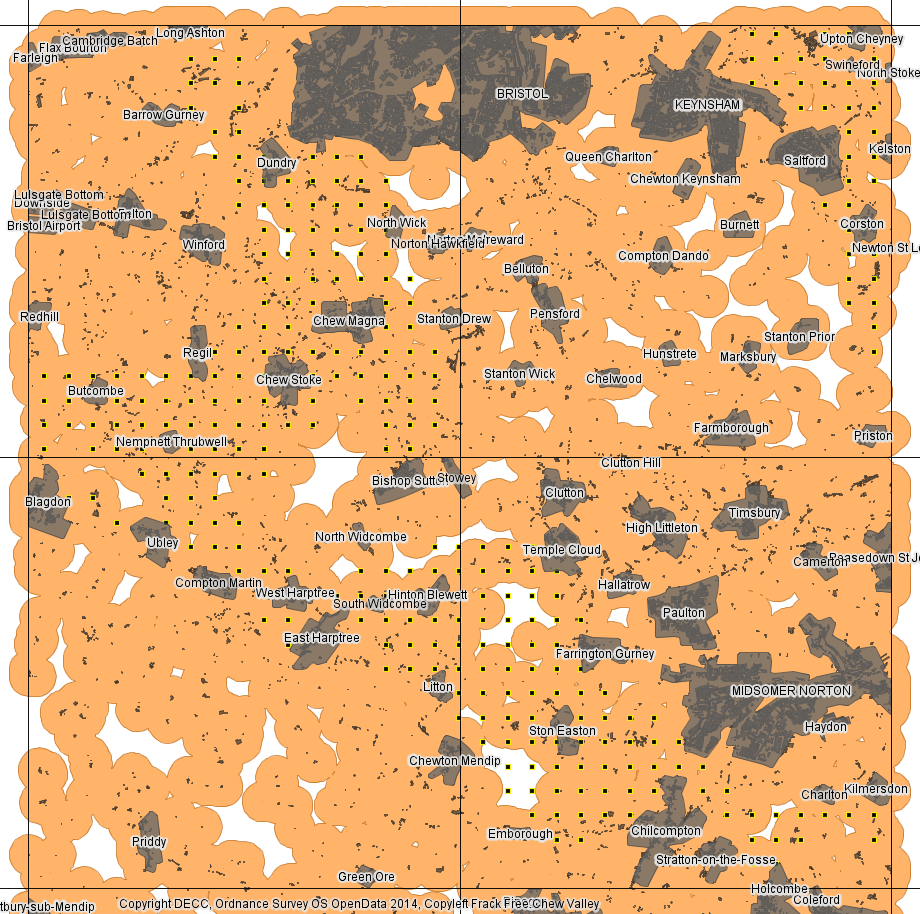
Performing the same exercise around the 300 hypothetical wells in Somerset as specified by DECC/GeoMet gives the following pattern in which there are 876 hectares of buildings within 2km of a well. So in Somerset there are 140 times more buildings within 2 km of a prospective gas well than at Wytch Farm.

Somerset 2km buffer around prospective wells
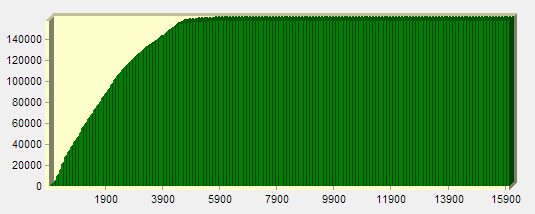
Another way to look at this is to look at the distance of all building from a well. So this graphic of cumulative area of buildings (Y) against distance to a well (X) for Wytch Farm shows that the proportion of buildings within 2 km of a well is almost zero.

Wytch Farm Cumulative Building Distance To Wells
Conversely this graphic of cumulative area of buildings (Y) against distance to a well (X) for Somerset shows that about half of all buildings would be within 2 km of a CBM gas well.
Somerset Cumulative Building Distance To Wells
For Wytch Farm about half of all buildings would be within 9 km of a well, in Somerset all buildings would be within less than 6 km of a well.
Based on information from the Department of Energy and Climate Change, the British Geological Survey and the Ordnance Survey it is pretty clear that conventional oil and gas production at Wytch Farm has little in common with coalbed methane development in Somerset either technically or spatially. The “put a hedge around it” argument is just not good enough.
Is 2 km too big? Let’s try a 460m zone around building like the Dallas City Council ban, what does that look like?
460 m Buffer Around Buildings
The Dallas ban applied in the Somerset CBM field would effectively squeeze out CBM development. Somerset’s rural areas are highly populated when compared to either America or Wytch Farm.
The Bad News and a Glimmer of Hope
NEWS ALERT!
The bad news is that FFCV has located a Department of Energy and Climate Change (DECC) report from 2000 prepared by American coalbed methane (CBM) specialists GeoMet Inc which lays bare what the government already knows about coalbed methane exploration in the Chew Valley and surroundings – the extent of the prospective area, the estimated volume of the gas and the number of wells needed to extract it. In the 400 sq km around the Chew Valley lake 108 sq km are considered prospective and if fully developed would require about 300 gas wells on a 566m well spacing. It is quite shocking that this public information has not been made available to local communities (or to BANES) so that they can make informed decisions about unconventional gas and how it might affect them, their families and their businesses. What is more this report was not referred to in the report on unconventional gas prepared for BANES by the British Geological Survey – even though they make reference to it in their national CBM evaluation. Read our web page on the subject and the report and maps we have prepared from the original government report and digital map data.

FFCV CBM Report
The glimmer of hope is that BANES has been informed by DECC that three of the four current Petroleum Exploration and Development (PEDL) licences covering Somerset have been relinquished (i.e. given back to the State) by the gas companies (PEDLs 225, 226, 228), including most of the Chew Valley catchment. However these PEDLs could be put back into the pot and offered again to other gas companies for exploration and development as part of the 14th Onshore Licensing Round, which is imminent. On the basis that these areas have now twice been evaluated by gas companies and twice they have decided not to develop them it is imperative that they are now excluded from further licencing rounds to protect them. Help make this happen by writing to BANES, to your MP and most importantly to Rt Hon Michael Fallon (correspondence@decc.gsi.gov.uk) the minister of state responsible for onshore unconventional gas. That the government should knowingly licence these sensitive areas exposes the extent to which the administration is willing to gamble with what David Cameron only recently described as one of “Britain’s greatest assets” – the beautiful countryside of the West Country – not to mention your well being.
Further bad news though is that licence PEDL 227 has been extended indicating that the company UK Methane is probably planning to apply for planning permission to drill an exploration bore hole. The DECC/GeoMet report indicates where within that PEDL the exploration might take place and if productive how may wells might be needed to extract it – its about 85.
Somerset PEDL Map (Source Frack Free Somerset)
Let your MP know what you think and make sure they know what the government actually knows about unconventional gas in their constituencies rather than listen to their parroting and cheer-leading of the coalition government’s position.
Cameron’s American Style Fracking Revolution in Somerset
In the Western Daily Press on the 9th June David Cameron lauded the West Country saying:
Then a couple of sentences later he says:
“We are legislating so that Britain can get the roads and the energy supplies it needs – unlocking our North Sea resources and developing shale gas, so that Britain is less dependent on foreign countries for its resources.”
Energy security is a serious matter but then, as he points out, so are the assets of the West Country’s beautiful countryside and cultural heritage on which so many local livelihoods rely. There is no coal or shale in Devon or Cornwall so he must be thinking of the prospect of unconventional gas in Somerset where the existing licenses stretch in a 20 km wide strip from south Bristol to “mystical” Glastonbury Tor passing mystical Stanton Drew on the way. He has also said that opponents to fracking are “irrational”, “religiously opposed” and “ideological”. However, in pushing for an American style shale gas revolution in Somerset the Prime Minister seems to want to have his West Country asset / shale gas (or coalbed methane) cake and eat it.
Considering that 450 sq km of Somerset is under threat of coalbed methane (CBM) development and that American coalbed methane experts Geomet Inc have calculated that 400 sq km of Somerset can accommodate up to 300 CBM wells, are local residents being either “irrational”, “ideological” or “religiously opposed” when they know that in America an “American style” coalbed methane revolution looks like this in the forests of the Black Warrior Basin in Alabama (white dots are CBM gas wells) :
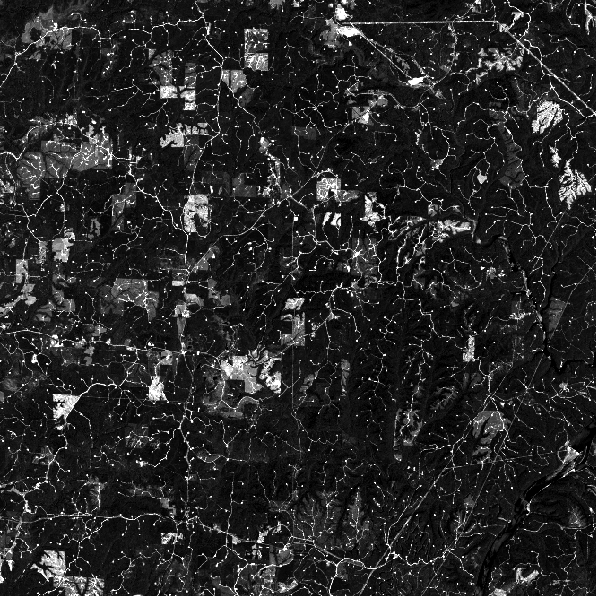
Black Warrior Basin, Alabama (Landsat 8, May 2014)
Or like this in the wilderness of the San Juan Basin in New Mexico:
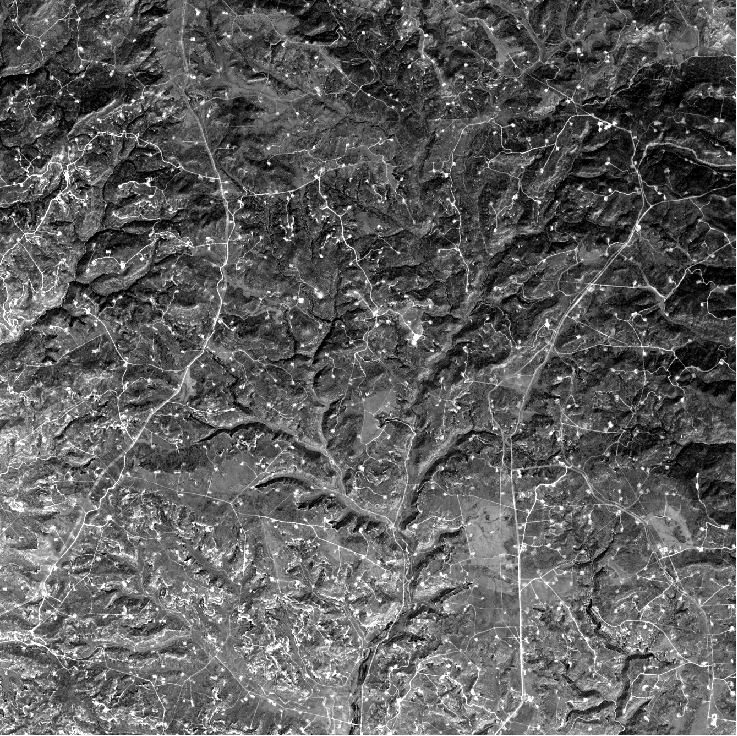
CBM San Juan Basin, New Mexico, (Landsat 8, June 2013)
Or in Australia like this in the Kumbarilla State Forest in Queensland:
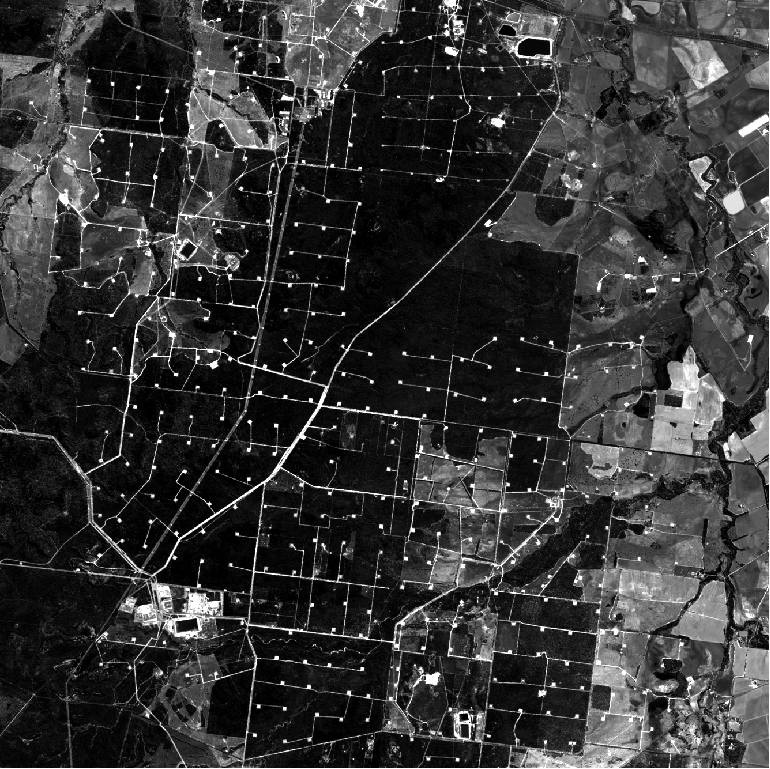
Kumbarilla State Forest, Queensland (Landsat 8, December 2013)
These examples are all recent satellite images of 20km by 20km (400 sq km) blocks of coalbed methane gas fields which have regular patterns of hundreds of wells between 400m and 800m apart.
Rather than the uninhabited forests of Alabama and Queensland or the wilderness of New Mexico the coalition government wants to impose a similar revolution on Somerset (and a huge chunk of the rest of the country), not in wilderness or forests but right inside our communities. Cameron can’t have it both ways. Let’s make sure that Cameron doesn’t put an end to what the West Country has to offer!
Pensford Film Showing, 29th April

Pensford Film Showing
Why Cuadrilla is Wrong about Shale Gas Carbon Emissions
On the 4th March 2014 shale gas company Cuadrilla (who have no current interest in exploration in Somerset) came to the Institute for Sustainable Energy and Environment at Bath University to give a talk entitled Why shale gas is key to economic revival and an environmental force for good although on the day it was called The Exploration for shale, why we’re doing this, why it’s safe and why it’s good.
The talk had three key points:
- shale gas is revolutionary and the UK can play a role in these changes
- the UK shale gas industry must communicate its experience
- gas consumption must be one of the key strategies in reducing CO2 emissions
The speaker cited “the six big myths” of fracking including the possibility of fracking fluids and hydrocarbons contaminating ground water and illustrating the “reality” of fracking at 3km depth in the Bowland shale of the north of England but seemingly with no knowledge of the geology of Somerset or of the Bath Hot Springs and how they work – i.e. the migration of water from the Mendips to great depths where it is heated to reemerge under pressure at the surface via an unknown network of existing fractures. No need for fracking then in Somerset as the geology already has fluid migrating from depth to the surface via all the geological strata. There was no mention in the Cuadrilla myth list of the Royal Academy of Engineering’s main concerns on well failure and surface spillage – “Both are common to all oil and gas wells and extractive activities” (RAE), so that’s not a myth then. One slide directly compared how much gas is there in the Bowland shale with the UK annual gas consumption but without mentioning that only a fraction of the resource can be economically recovered or mentioning that the Houses of Parliament Office of Science & Technology says that “there are currently no official reserve estimates”.
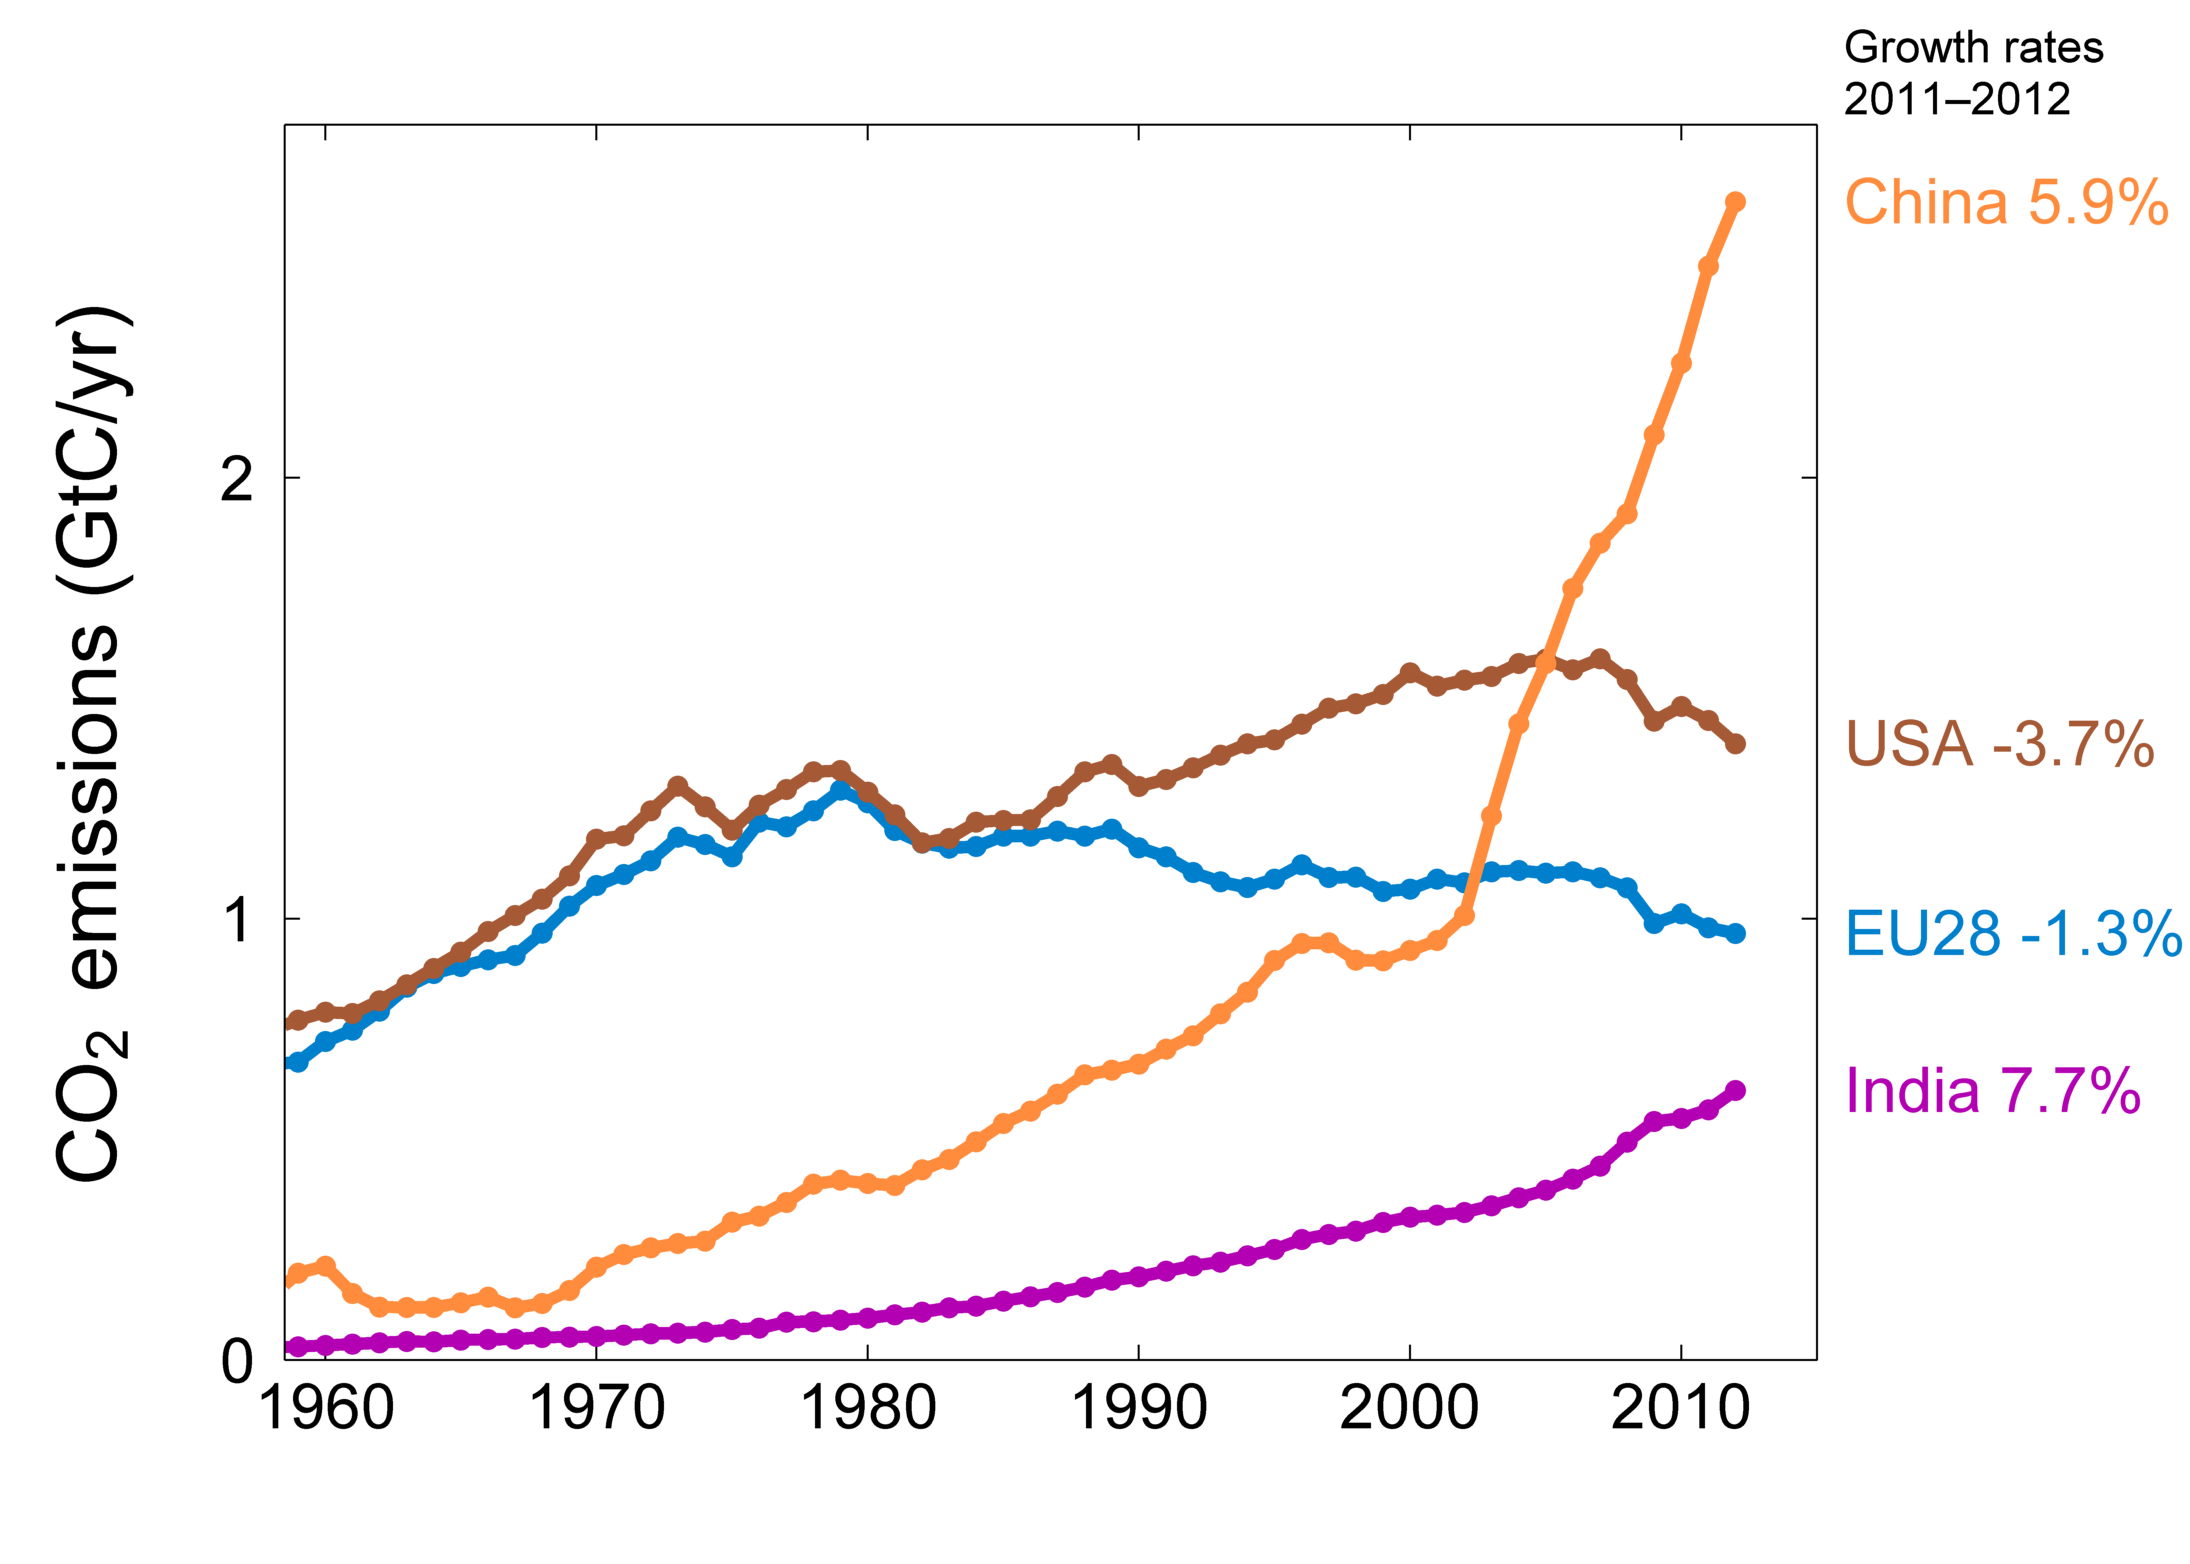
This post however is not about shale gas resources and reserves or about the complex Somerset geology, it is about Cuadrilla’s assertion that “continued gas consumption must be one of the key strategies in reducing CO2 emissions”. Cuadrilla’s message is basically that gas is less dirty than coal and that shale gas has brought down emissions in the USA – so wouldn’t it be great if the UK could do the same. To illustrate this they compared the annual US natural gas production (EIA 2013) with the CO2 emissions of the top four emitters (Global Carbon Project).

US Natural Gas Production by Source
Global Carbon Project 2013, Top Fossil Fuel Emitters
So increased US shale gas production results in reduced US CO2 emissions because methane generates less emissions per unit of energy than coal. But that is not the whole story. Caudrilla did NOT show the following slide, from the same source, which shows that whilst the per capita emissions in the USA are declining they are still more than double the per capita emissions in the European Union where emissions are also declining but without any shale gas. US emissions are about four times the world average. This highlights the fact that if the US concentrated on energy efficiency it could drastically reduce its per capita emissions.
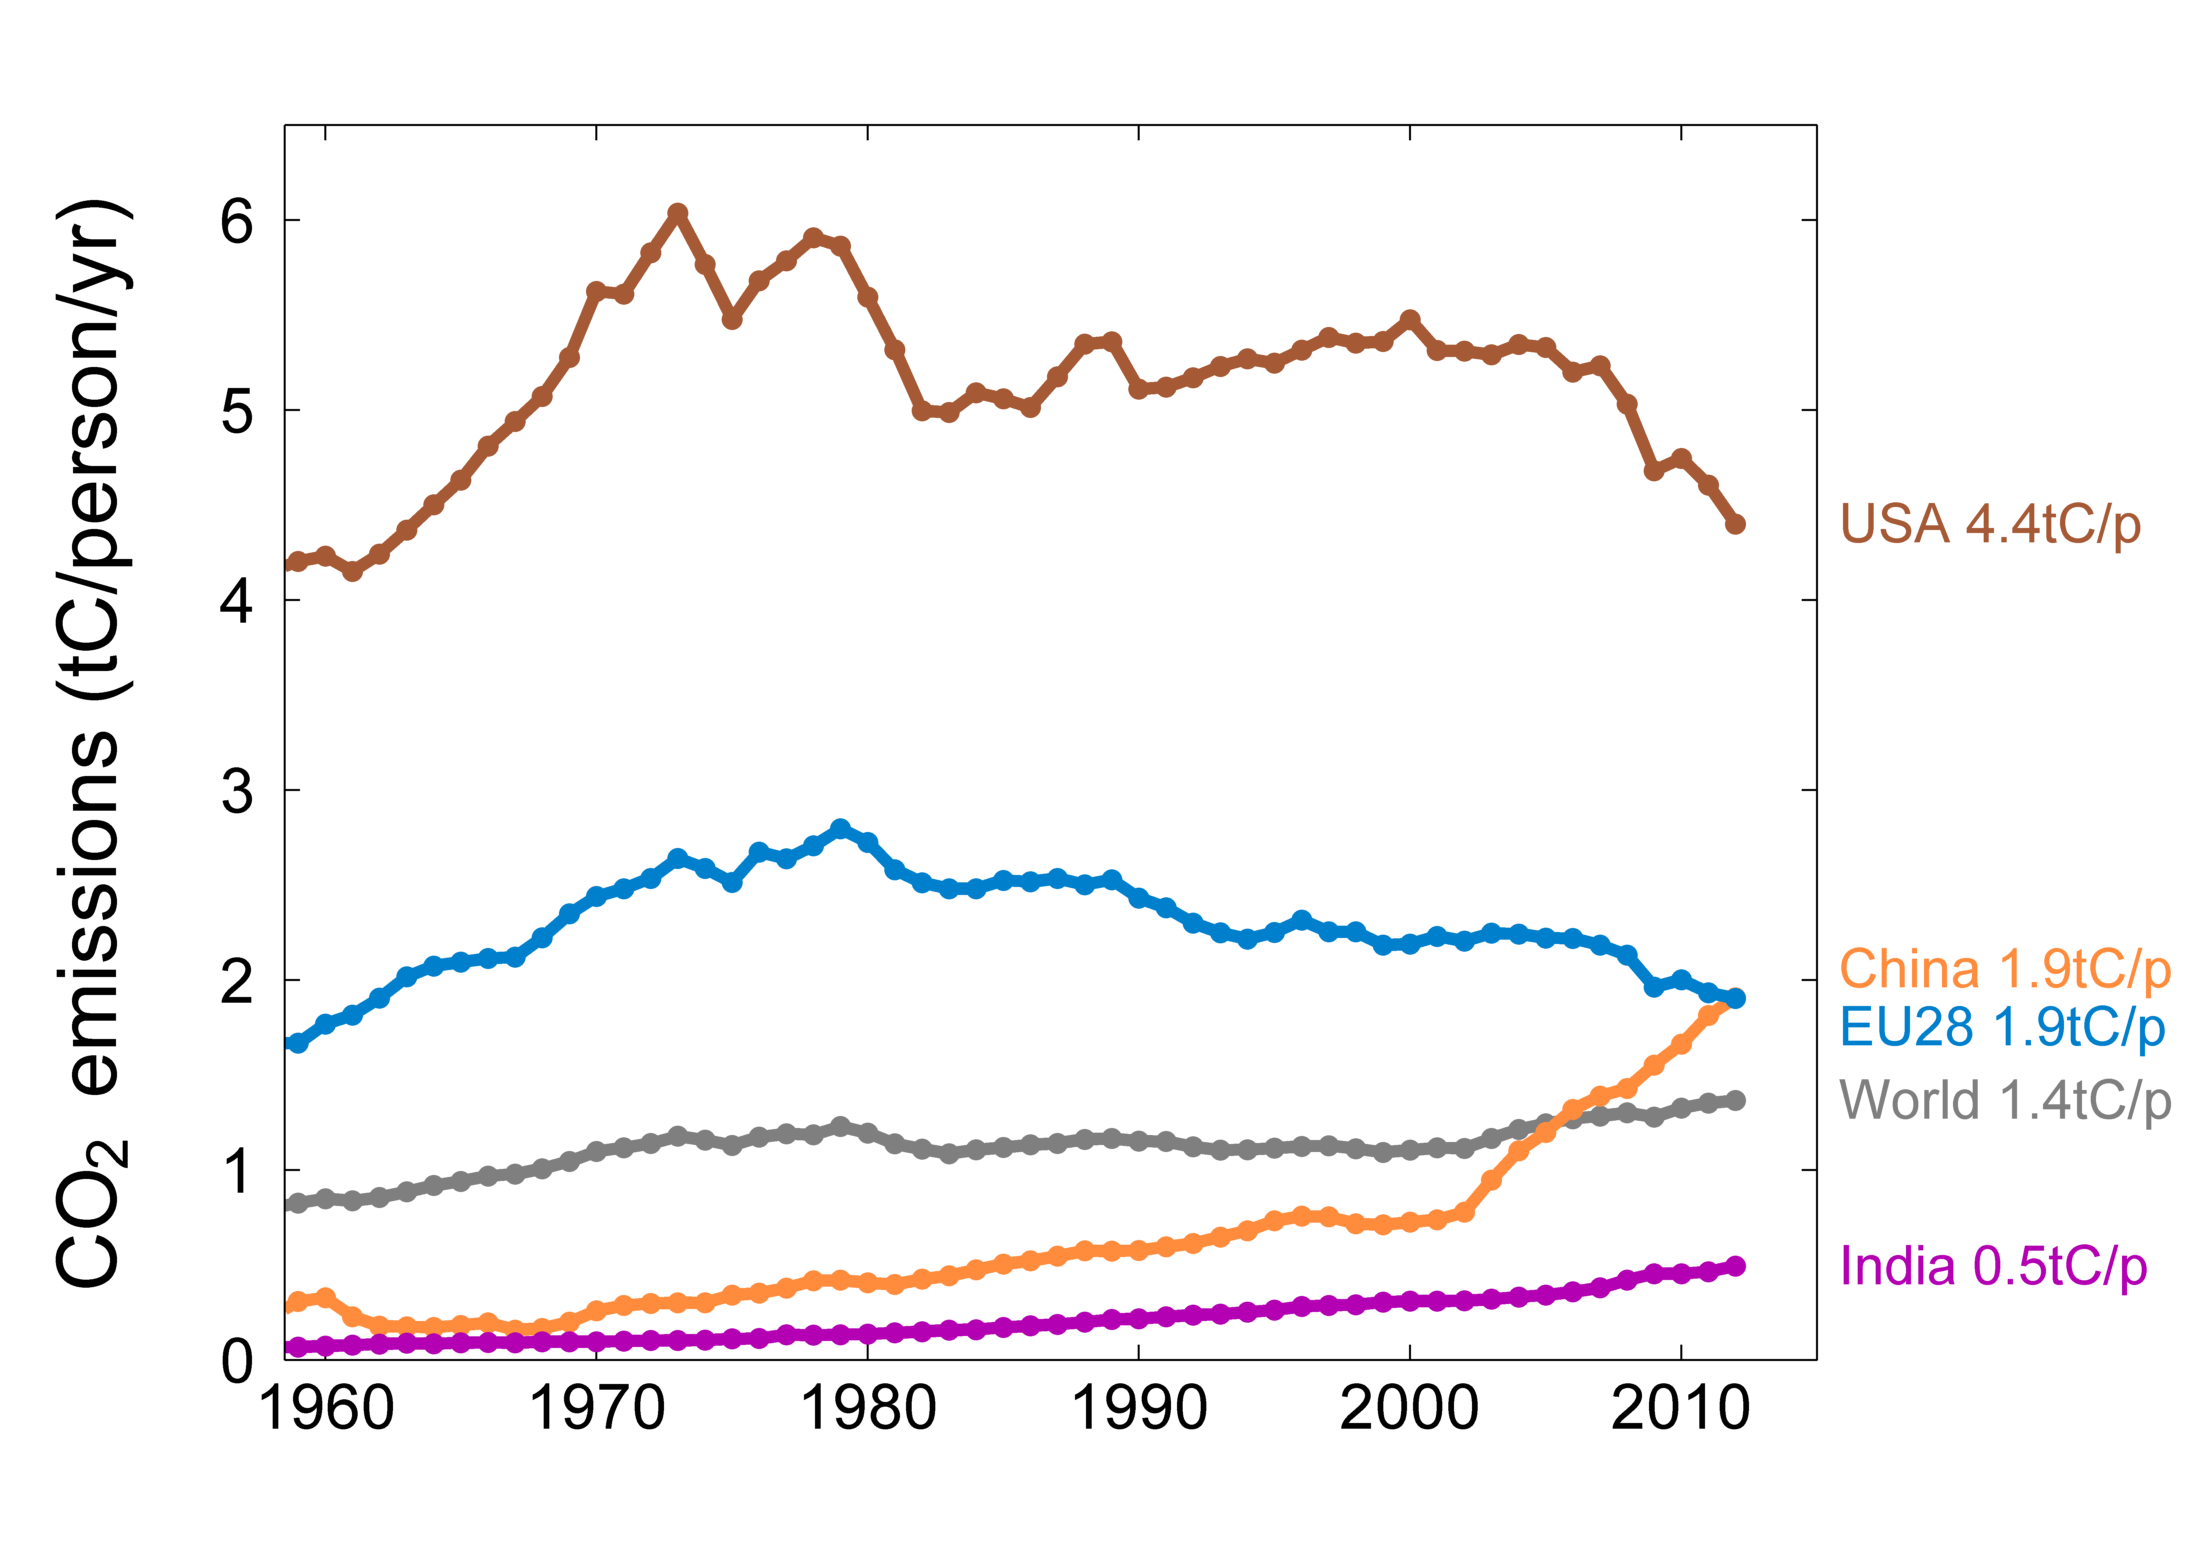
EIA, Average per capita emissions of the top four emitters in 2012
So if the USA is the number two CO2 emitter in the world and shale gas has had such an amazing impact on lowering US CO2 emissions then we might expect to see such good news as a reduction in global CO2 emissions? Do we?

Global Emissions by Country, Global Carbon Project
Err, no. Where is the dip? The dirtier fuels, like coal, which are displaced by the less dirty shale gas do not stay in the ground. The US miners have not all gone home, the mine owners have not all shut up shop. The coal still gets dug up and is exported to other countries in Asia and Europe where they are burnt. As the EIA says “U.S. coal production largely follows the trend of domestic coal consumption, but increasingly it is influenced by coal exports.”
Emissions don’t go down they go up because the shale gas is additional to, not instead of, the existing fossil fuel production. The IEA’s business as usual reference case for US coal production looks like this and shows a pickup in US coal production year on year after 2016 “as a result of growing coal exports and increasing use of coal in the electricity sector as electricity demand grows and natural gas prices rise” (EIA 2013).
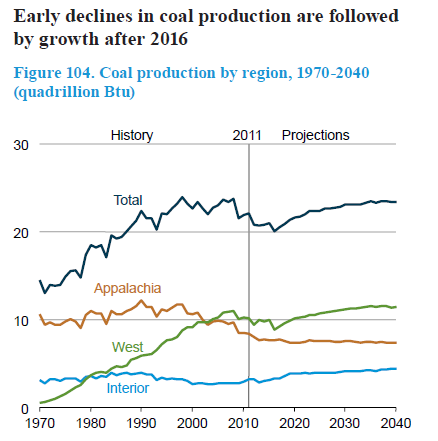
EIA, US Coal Production 1970 – 2040
So, if US natural gas production is forecast to increase and so is coal after 2016 where is the CO2 benefit in the US coal for shale gas displacement equation? The Earth doesn’t care where the emissions come from (the USA, China, Europe, or wherever) it only cares what the global cumulative emissions are.
The Department of Energy and Climate Change recently published their report Potential Greenhouse Gas Emissions Associated with Shale Gas Extraction and Use (2013) which emphasises “The view of the authors is that without global climate policies (of the sort already advocated by the UK) new fossil fuel exploitation is likely to lead to an increase in cumulative GHG emissions and the risk of climate change.” This report also contains the following graphic which shows that in terms of the CO2 emissions per KWh generated that shale gas is less clean than conventional gas and the UK current blend but somewhat cleaner than non-EU gas and Liquid Natural Gas, based on the assumption that 90% of the methane released on shale gas well completion is captured and flared. This is the figure from the DECC report:
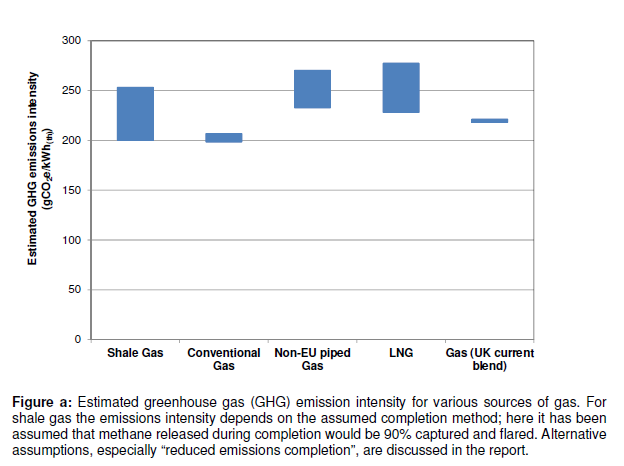
Gas emissions intensity, DECC (2013)
Cuadrilla however reckon that they can capture 100% of gas through so called green completions so they have changed the DECC graphic to make it look like all shale gas might be subject to 100% gas recovery, not just by them but by everybody else as well. The Cuadrilla version was shown in their presentation with the words “with green completions” annotated in brackets. What evidence is there that Cuadrilla have ever achieved 100% gas recovery? They have never produced any gas so this is wishful thinking.
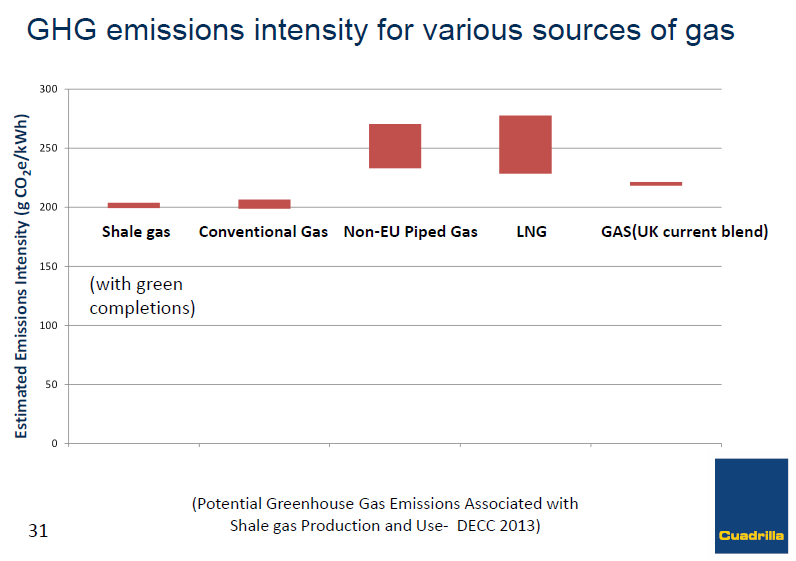
Gas emissions intensity, Cuadrilla
The Tyndall Centre for Climate Change Research has also published a report on shale gas and climate change impacts, Shale gas: an updated assessment of environmental and climate change impacts, and say “any new sources of fossil fuel, even if relatively low carbon per unit of useful energy, are likely to be combusted and consequently add to the global emissions burden“.
So, in summary, both the Tyndall Centre for Climate Change Research and DECC (McKay and Stone) say that in the absence of a binding global emissions agreement that shale gas will add to cumulative greenhouse gas emissions and contribute to further global warming, whereas Cuadrilla say that shale gas will reduce emissions on the assumption that it will displace coal. There is no binding global emissions agreement, so who is right? Who does the Rt Hon Michael Fallon (the responsible Minister) agree with – the Chief Scientific Advisor of his own department or the executives from a gas company with a vested interest in extracting the gas?

Rt Hon M Fallon Letter re GHG emissions
“The UK hopes that Shale Gas will be a significant part of our future energy mix. This will of course be in a way that is completely compatible with our legally binding climate change targets.” “If shale proves commercially viable and cost effective then it could have a key role in meeting our climate goals in a least cost way – that is good for consumers and the environment”
It is worth noting that both the Tyndall Centre and the DECC report both say that UK shale gas will have virtually no impact on UK gas prices. “Good for consumers and the environment”?
In June 2013 when asked about climate change Michael Fallon replied “You are getting me into theology now, I don’t deal with that, that’s the other side of the department, isn’t it?”
NB Caudrilla do not have any current interests in Somerset where the licence holders are UK Methane and Shale Energy PLC. UK Methane and Shale Energy plc have.
Stop Fracking in Somerset Petition
Fed up with the thought of unconventional gas development being foisted on Somerset? Feel powerless? You can make your feelings known by signing a petition. Such action has recently made Bristol City Council think about it seriously:
http://www.bristolpost.co.uk/yhyh/story-20826393-detail/story.html
If you want your voice heard you can sign a petition on unconventional gas development and fracking here:
https://you.38degrees.org.uk/petitions/stop-fracking-in-somerset
Radford Mill – Frack Free Festival
Book a ticket for the Radford Mill Farm Frack Free Festival on Saturday 3rd and Sunday 4th May 2014, in the Cam Brook Valley.

Radford Mill Festival
Coalbed Methane in Queensland – a cautionary tale
Mr Rees-Mogg MP recently posed the question (Chew Valley Gazette, Feb 2014) as to what impact an unconventional gas “well head” might be on the Chew Valley countryside? By “well head” he presumably means a solitary test well. The Chew Valley is covered by two exploration and development licenses so there could be two exploration wells. If successful exploration may lead to development. The development of coalbed methane (known as coalseam gas in Australia) in the Kumbarilla state forest in Queensland will have started with a similar single exploration well. What happened next?
In 2003 the Tipton West gas field didn’t exist, by 2006 Arrow Energy was producing electricity in gas fired power stations fed by coalbed methane. The Landsat 7 satellite image, below left, shows a 20km x 45km area around the Kumbarilla state forest, between Tara and Dalby, in September 2003. Click on it to zoom in. At this time there were no gas wells.
 Kumbarilla State Forest, Landsat 7, 2003. |
 Kumbarilla State Forest |
The dark blocks in the image are bush/forest and the lighter areas bare soil, roads and crops. In the north east is an area of agricultural production. This is a similar size to the Somerset licence area which is 20km wide and 35km deep.
By December 2013 about 625 gas wells have been developed in this area alone. There are also many kilometres of access roads, high pressure gas pipelines, water pipelines, an open cast coal mine and a number of gas fired power stations. See the December 2013 satellite image below left.
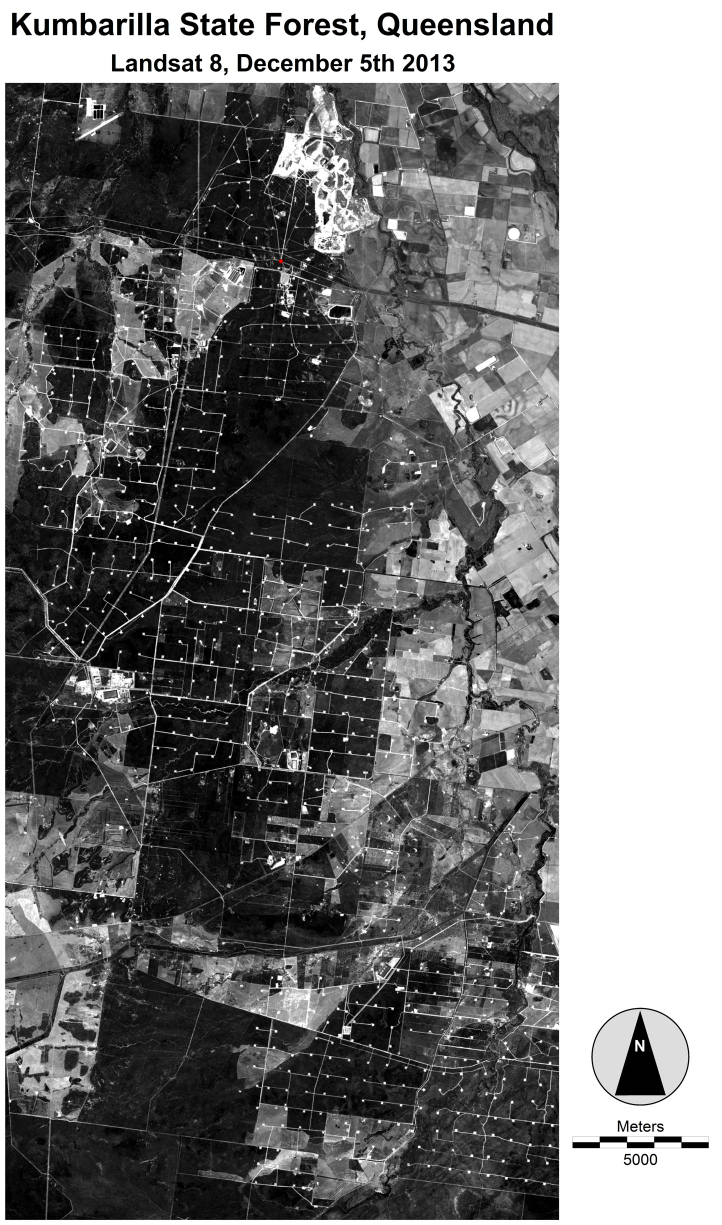 Kumbarilla State Forest, Landsat 8, 2013. |
 Kumbarilla State Forest |
That’s not it, there are more gas wells beyond the bounds of the image and that little sign at the side of the road says “Warning High Pressure Gas Pipeline”. The entire landscape has been industrialised.

Warning
That is scale of industrialisation that comes with a CBM gas field but it is only the tip of the iceberg. Mr Rees-Mogg also says that “there have been no recent problems as the industry has developed”. Well, this gas field has experienced blow outs, flares burning for months on end, exploration wells on fire which can’t be put out, gas bubbling up through the ground, health impacts, etc, etc.
All this will have started with just one test well. Fully exploiting the gas resource, which is what the gas companies obviously want to do, involves dozens or hundreds of wells, not one. In comparison with the Kumbarilla/Tara/Dalby Somerset is a highly populated place.
The wisdom of putting more than 650+ gas wells and open flares in a fire adapted forest ecosystem is a question for the Queensland state government. What could possibly go wrong?

Kumbarilla Fire, Dec 2012.
Queensland Fire & Emergency Service
The Chronicle – Bushfire burns in Kumbarilla State Forest near Dalby
